Troubleshooting direct collection problems
A best practice for troubleshooting collection problems is to start on the high-level Collection Status page and then drill down to the Device Manager.
If you discover problems with direct collection, you can attempt to remedy them before contacting Technical Support.
Reset connection statistics
When you reset collection statistics, all historical direct connection statistics in the database are removed. The Device Manager will show unknown status for all devices until collection is run again (either initiated manually or by a schedule chain running with an appropriate adapter).
In the Device Manager, you can reset connection statistics for selected devices. After connection statistics are reset, every SNMP and WMI status and history for every device changes to unknown (a gray question mark), and remains unknown until collection is run again according to the defined schedule).
To reset connection statistics
1. Log in to the UI as a user with administrative privilege.
2. Choose Configure > Device Manager.
3. Select one or more devices of interest from the Device Table.
4. Click the action menu (

) at the top of the page, and select Clear.
5. Select Clear Collected Data. You are prompted with a warning.
This operation cannot be undone.
6. Click OK to delete all device statistics.
Autoconfigure devices
The technique of repeated attempts might be detected by a network security mechanism, which could result in the device locking out a particular username or blocking communication from NetIM’s IP address entirely.
To autoconfigure a device is to automatically clear and repopulate its SNMP and WMI settings in the Device Manager. Assuming NetIM has network access to the device, it queries the Global Credentials List for one of several potentially correct login credentials, accesses and attempts to log in to the device, and repeats the process until a login is found to be successful. When login is finally successful, NetIM then ascertains additional settings for the device.
1. Log in to the UI as a user with administrative privilege.
2. Choose Configure > Device Manager.
3. Select one or more devices of interest from the Device Table.
4. Click the action menu (
) at the top of the page, and select Collection. The following screen appears:
5. Select Auto-configure. A warning screen appears indicating that all existing access settings (username, password, login script, SNMP community string, and WMI credentials) and device driver associations will be erased and replaced.
6. Click OK to run autoconfig on the selected device or devices.
After Autoconfiguring devices, wait until the model is refreshed automatically.
Troubleshoot SNMP Collection
The SNMP Collection Status listings in the following tables match the columns in the device table of the Device Manager filtered by the Views menu. Use the listings to troubleshoot problems with SNMP collection.
SNMP Collection status | Description | Next steps |
|---|
SNMP Collection Succeeded | NetIM connected, was authenticated, and queried the device’s MIBs by means of SNMP. | no action |
SNMP Collection Not Attempted | Portal did not attempt collection. | |
SNMP Connection/Login Failed | NetIM could not establish a connection to the device, or could not log in, so Collection was not even attempted. | |
SNMP Collection Failed | NetIM connected and logged in to the device, but OIDs were not successfully queried. | |
Troubleshooting ‘SNMP Collection Not Attempted’
Possibility | Where to look | Resolution | Next steps |
|---|
The device’s Active flag was not set, so NetIM does not interact with it. | Device Manager > Active column | Set it in the Device > Action Menu > General > Edit check box in the appropriate tabs. | Wait until the model is refreshed automatically (by tomorrow). |
The device’s SNMP check box was not set, so NetIM does not attempt to perform direct collection by means of SNMP. | View/Edit Device > Action Menu > General > Edit > SNMP check box | Set it. | Wait until the model is refreshed automatically (by tomorrow). |
The v1/v2 Read Community String or v3 settings are missing. | Check Configure > All Settings > Global Discovery Settings | Verify that the community string for this device exists in the credentials list, and then see Autoconfigure devices. | Wait until the model is refreshed automatically (by tomorrow). |
View/Edit Device > Action Menu > General > Edit > SNMP. Community strings always appear as ****, so you won’t know if a string is incorrect or missing just by looking on the SNMP tab. | Supply credentials by hand on this tab, or see Autoconfigure devices. | Wait until the model is refreshed automatically (by tomorrow). |
Troubleshooting ‘SNMP Connection/Login Failed’
Before using this table, be certain that connection was attempted.
Possibility | Where to look | Resolution | Next steps |
|---|
SNMP v1/v2 or v3 settings are incorrect. | View/Edit Device > Action Menu > General > Edit > SNMP. Community strings always appear as ****, so you won’t know if a string is incorrect or missing just by looking on the SNMP tab. | Retype the community strings onto the SNMP tab if you know them. | Wait until the model is refreshed automatically (by tomorrow). |
Check Configure > All Settings > Global Discovery Settings and unhide the community strings, and then verify that the correct community string appears in the set. Then see Autoconfigure devices. | Wait until the model is refreshed automatically (by tomorrow). |
Device is not reachable through network. | Check firewalls and network health. Verify that device is up and listening for SNMP on port 161. Use Wireshark to verify that packets are returning from the device. | | |
Device is reachable through network, but you’re not sure whether SNMP agent is returning requested OIDs. | | Verify that the device’s sysName can be queried. | |
Troubleshooting ‘SNMP Collection Failed’
Before using this table, be certain that login was successful.
Possibility | Where to look | Resolution | Next steps |
|---|
NetIM encountered unexpected SNMP response. | See SNMP troubleshooting using the built-In MIB Browser and verify that the device’s sysName can be queried. | Set sysName on the device (which is required for correct operation of SNMP). | Wait until the model is refreshed automatically (by tomorrow). |
SNMP troubleshooting using the built-In MIB Browser
The following procedure describes the basic steps for accessing a device and checking its sysName.
1. To access any device’s SNMP agent, open a command prompt on NetIM core and run:
app.sh MIB_BROWSER
This is a UI-based utility. You must use X or an xrdp session.
2. In the MibBrowser’s Host and Community fields, enter the host name and read community string of the target host.
3. Press Enter and wait for the device’s MIB structure to load into the MibBrowser.
4. Navigate to and select the sysName variable in the MIB tree.
5. Click Get SNMP Variable in the toolbar.
See the result in the Display area. In this example, the sysName is NC-WIN-DVNES3.opnet.com.
Troubleshooting telemetry metric collection
When troubleshooting telemetry collection issues, verify the configuration flow from NetIM core through the Config Service to the Telemetry Telegraf service.
Verify NetIM core configuration
After configuring DnPI information with Telemetry Dial-In enabled, wait up to 10 minutes, then check the following directory:
<vne_home>\lib\sda\TelemetryTelegraf\config\1\telegraf.d
You should see a recently changed file named gnmi<#>.conf.
The file appears as encrypted binary data (this is expected for security).
If the file is missing, check the LUS slf4j log file for 'gnmi' messages after saving the DnPI entry, or restart the auxiliary service to force the configuration push.
Verify Config Service synchronization
SSH to the swarm manager and check the following directory:
common/config-service/netim/config-repo/<tenant-id>/resources/lib/sda/TelemetryTelegraf
The directory contents should match the NetIM core directory, including the recently updated /TelemetryTelegraf/config/1/telegraf.d file with matching file sizes.
NetIM core - Telegraf
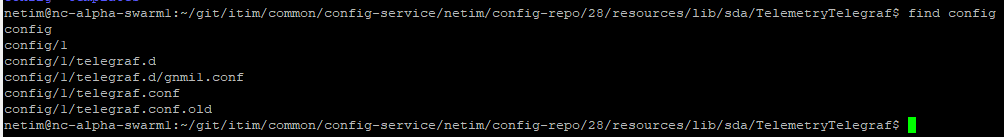
As of September 16, 2024, the location changed to:
/git/itim/common/config-service/netim/config-repo/<tenant-id>/resources/lib/sda/TelemetryTelegraf/config/1/telegraf.d
If synchronization failed, check the LUS slf4j log and Config log.
Verify Telemetry Telegraf service
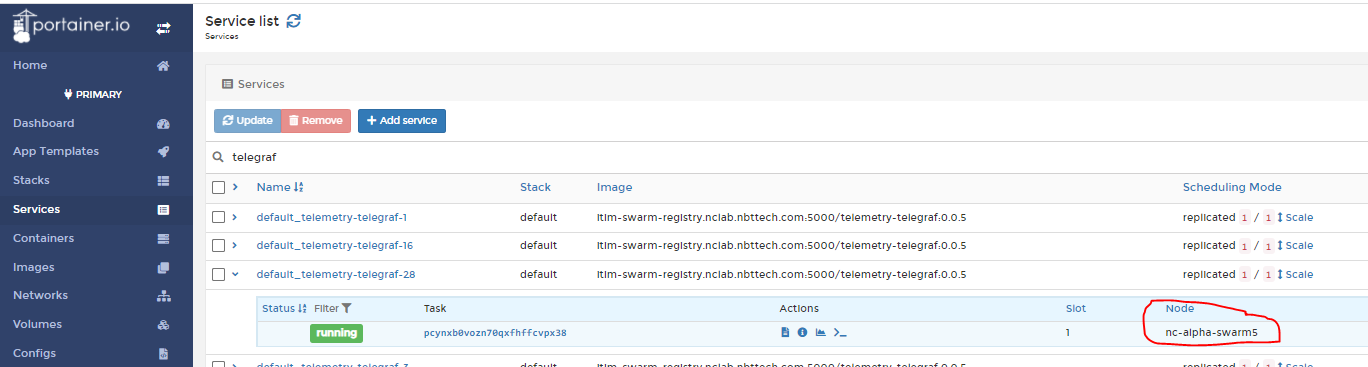
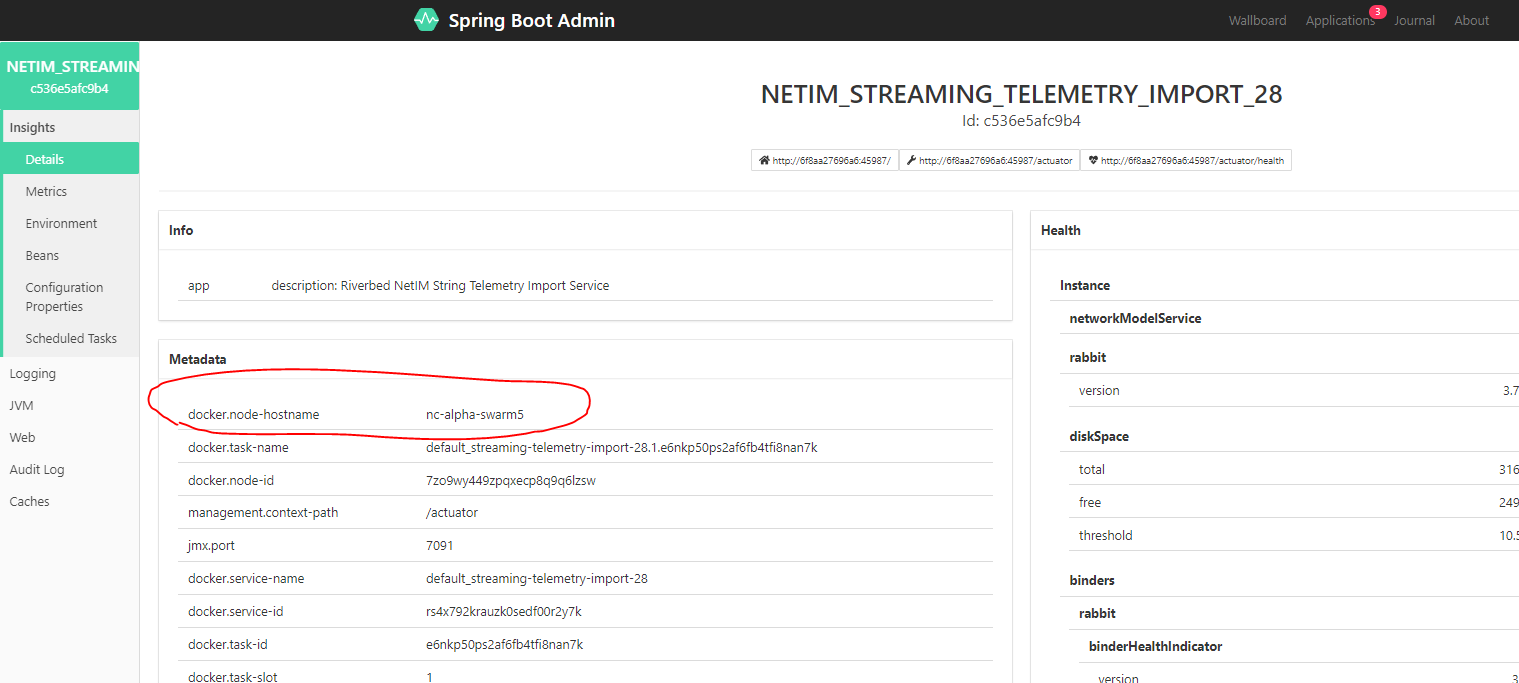
Find the service location using Portainer or Spring Boot Admin (alpha/beta swarm). The service runs on the core node as part of core-tenant-stack.
Telemetry Telegraf - Portainer
Telemetry Telegraf - SpringBoot Admin
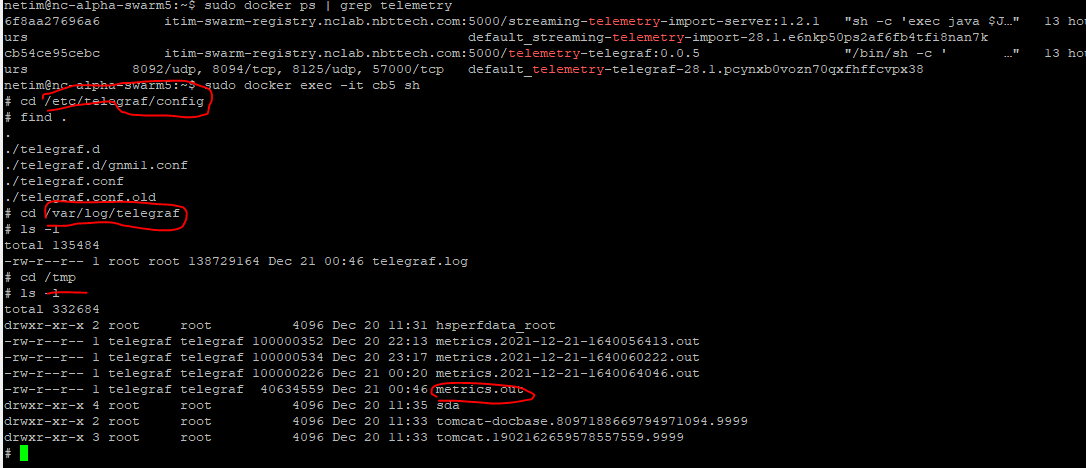
To check the service, SSH to the docker worker node and run docker ps | grep telemetry to find the container ID.
NetIM core - Container ID

Then run docker exec -it <container-id> sh to access the container. Verify that config files are at /etc/telegraf/config, check the log file at /var/log/telegraf/telegraf.log for connection and data reception information, and review the metrics output at /tmp/metrics.out which contains all received Telemetry metric samples.
NetIM core - Telegraf Container Files
Verify telemetry data
If telemetry data does not appear to be coming in, verify the following:
• Ensure all required features and packages are installed.
• Verify routing and network connectivity between the device and collector.
• Check that certificates are properly installed and configured (for dial-in with TLS).
• Verify that the collector IP address is allowed in the notification allow-clients configuration.
• Confirm that sensor profiles are active using show agent sensors.
Verify transform compatibility
Some documentation describes how to configure a JUNOS device to support OpenConfig YANG models and example output. Since this data may vary by device and configuration, you should verify the actual output format.
1. Metric naming differences—Some metrics may not align with expected names. For example, "rx-bytes" and "tx-bytes" may be returned instead of the expected "in_octets" and "out_octets". You may need to include these additional metrics in your interface transformers or calculate based on these metrics.
2. Path structure differences—Some paths may not match expected structures. For example, "oper-state" may be under /interfaces/counters/oper-state instead of the expected /interfaces/oper-status at the interface level. NetIM transformers may handle this with relaxed matching that uses "contains"-based matching on the metric name.
3. Aggregated metrics—Some metrics may be returned as aggregations. For example, "rx/tx-packets" may be shown as a single metric, while NetIM transformers expect them split into separate metrics (in/out_unicast_pkts, in/out_broadcast_pkts, in/out_multicast_pkts). You may need to enhance calculations in transformers to accommodate this.
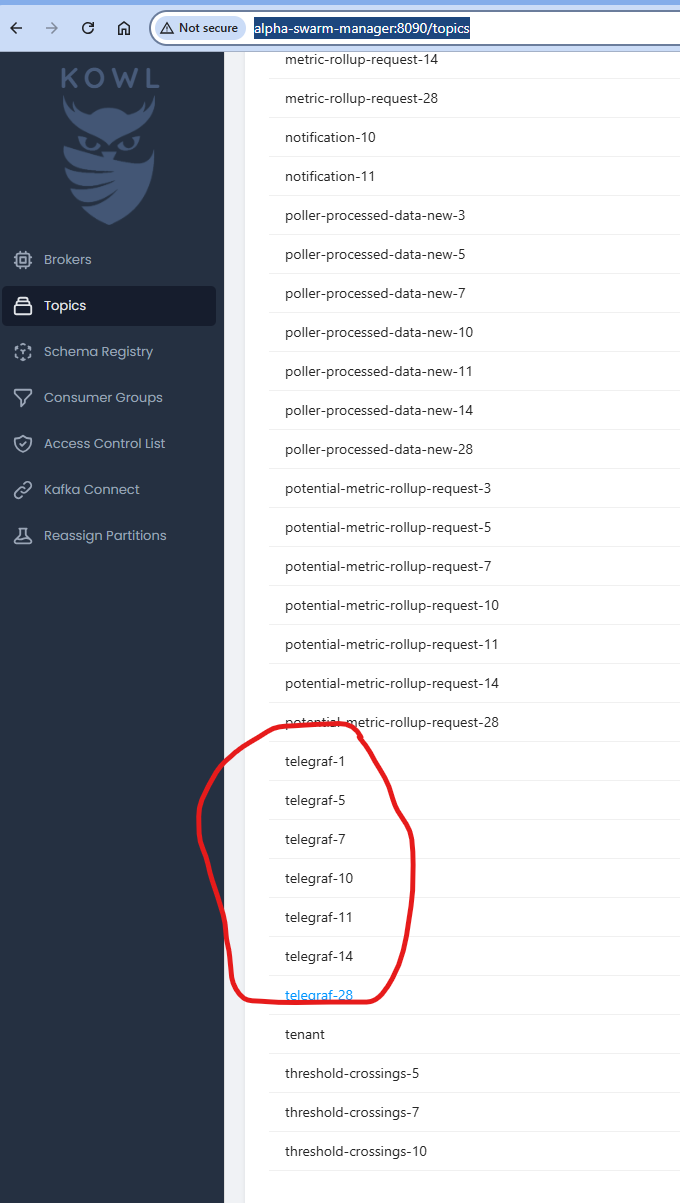
Verify Kafka data flow
The following figure is taken from a development environment that supports multiple tenants (one for each developer). On client installations, only tenant 1 is available.
Telemetry data is sent to Kafka queue telegraf_<tenantID>. To view data, use Kowl at http://<swarm-manager>:8090/topics. For deployment, SSH to the manager node, start the adv-monitoring-stack/kowl service, then access via browser.
Telemetry Telegraf - Kowl
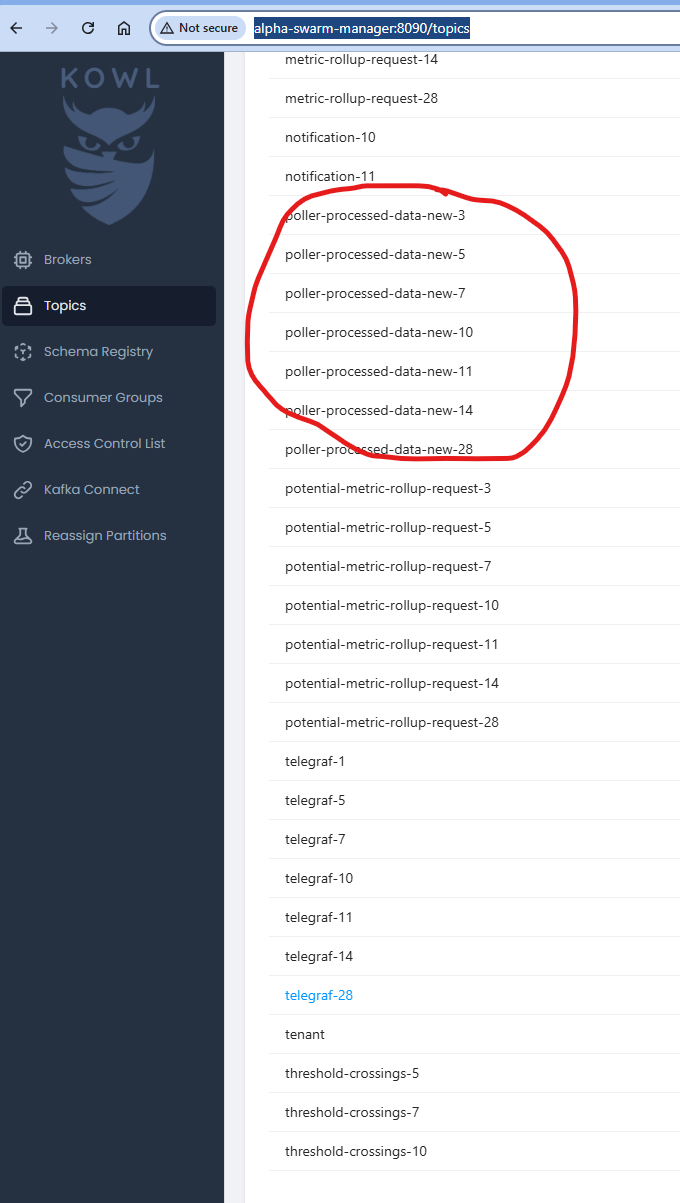
Verify data processing
The following figure is taken from a development environment that supports multiple tenants (one for each developer). On client installations, only tenant 1 is available.
The Streaming Telemetry Import service processes data from Kafka and creates NetIM metric samples. To verify, use Kowl to check topic poller-processed-data-new-<tenantID>.
Telemetry Telegraf - Kowl
GNMI configuration file location
After configuring devices for Telemetry, settings are saved at <NETM Install>/lib/sda/TelemetryTelegraf/config/1/telegraf.d/ on Core.