About streaming telemetry
Streaming Telemetry (or Model-Driven Telemetry) is a rapidly evolving technology for network monitoring. Metric data can be streamed from network devices continuously and at a high granularity thereby providing near real-time access to operational device metrics. NetIM can subscribe to specific data using standards-based YANG data models.
Streaming telemetry topology
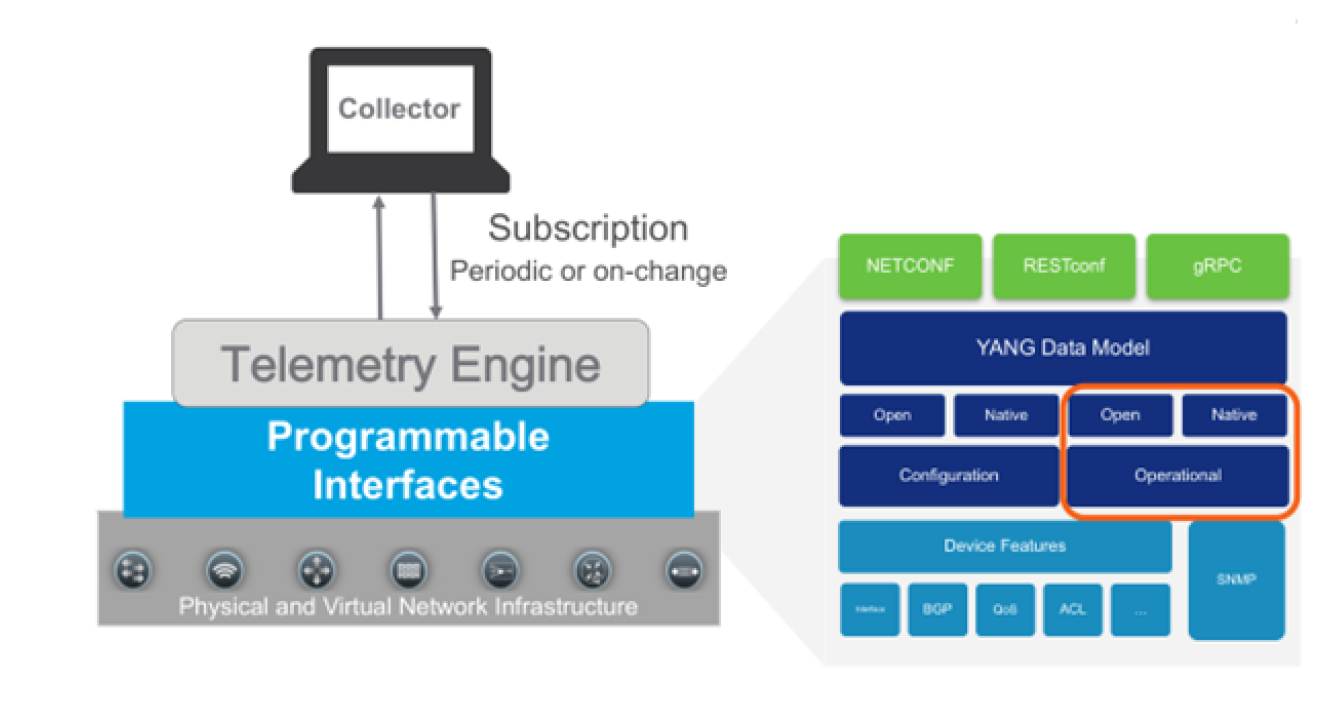
NetIM sets up a subscription to a data set in a YANG model. A subscription is a contract between a subscription service and a subscriber that specifies the type of data to be pushed. Subscription allows clients to subscribe to metric data and the device pushes the data to the collector for the subscribed data. Streaming telemetry data can be sent periodically or on-change.
NetIM currently expects periodic. Streaming telemetry configuration can also be dial-in or dial-out. Streaming telemetry provides device metric data to NetIM at a much higher frequency, more efficiently than classic SNMP is able to do. NetIM’s Streaming Telemetry support populates existing metric classes and is configured per device within the NetIM Device Manager.
Many resources exist for learning about streaming telemetry and vendor implementations. We do not attempt to duplicate the many excellent sources of material that exist for reference. We provide basic information on configuring your network devices for streaming telemetry. You should reference each vendor’s reference and configuration guides for comprehensive information on how to configure vendor devices for streaming telemetry. We will focus on how you configure NetIM to successfully receive the streaming telemetry data.
NetIM’s Model-driven Telemetry Receiver microservice is hosted on the NetIM Core VM. Use the IP address of the core VM as the address to use for configuring streaming telemetry on your network devices (at TCP port 57000 for dial-out). Check with the device vendor regarding which specific models and OS versions support streaming telemetry. In some cases, additional vendor feature licensing may be required for the devices to support streaming telemetry.
For streaming telemetry, configuration is required on NetIM UI, as well as, on the device. You must first ensure that you have an existing device object with interfaces in NetIM. The NetIM device model can be created by using either CLI data or SNMP data. However, you should ensure that SNMP polling is turned off for the devices for which you want the streaming telemetry data. Once the device model is created, configure the actual network device and then NetIM for telemetry collection.
NetIM supports both dial-in and dial-out.
• Dial-in—The network device listens on an established port for the Collector (NetIM) to subscribe (dial-in) to collect the metrics.
• Dial-out—The network device dials-out to the Collector (NetIM’s Telegraf instance) running on the core VM. In dial-out, the network device initiates the connection.
For dial-in, NetIM creates a gNMI subscription template. The NetIM template requests that metric data to be provided at 10-second granularity. The device may abide by the 10-second granularity request or ignore it. The actual metric granularity provided is negotiated with the device with the requested granularity in the template just a suggestion to the device.
Communication between the device and NetIM is encrypted as TLS is enabled by default. TLS can be disabled to support unencrypted communication. Unencrypted communication requires manual configuration. SSL certificate validation can also be enabled.
Basic steps for setting up streaming telemetry in NetIM
1. Configure a device in the Device Manager for CLI or SNMP collection. At least one collection needs to be enabled to generate a device model to hold metric data. Optionally, you can avoid metrics collected from more than one source by disabling "Metric Polling Active".
2. Perform a collection from the device and ensure the device model has attributes, interfaces, and interface attributes in NetIM.
3. Configure the device to enable streaming telemetry for dial-in or dial-out.
4. Once your device is configured for streaming telemetry, you can enable streaming telemetry for the device in the Device Manager. Select the Telemetry Option.
– For gNMI dial-in, provide the IP address, port, and credentials.
– For gNMI dial-out, you need to configure on the real device to publish data to NetIM. NetIM is pre-configured to receive on port 57000.
5. To visually confirm you have started to receive streaming telemetry, just check the At a Glance page for the metrics. You should see metrics at the granularity you have configured for streaming telemetry.
We will document some details on how to configure various device types for Streaming Telemetry integration. This documentation is not a replacement for your device vendor configuration guide.
Streaming telemetry for Cisco IOS-XR
Cisco IOS-XR Dial-Out Support
Metric Class | Origin | YANG Model Path |
|---|
DEV_STATUS | Device | sensor-path Cisco-IOS-XR-nto-misc-oper:memory-summary/nodes/node/summary |
MEM_USAGE_v2 | Device | sensor-path Cisco-IOS-XR-nto-misc-oper:memory-summary/nodes/node/summary |
CPU_UTIL | Device | sensor-path Cisco-IOS-XR-wdsysmon-fd-oper:system-monitoring/cpu-utilization |
IFC_STATUS | OpenConfig | sensor-path openconfig-interfaces:interfaces/interface/state |
IFC_UTIL | OpenConfig | sensor-path openconfig-interfaces:interfaces/interface/state |
IFC_ERROR | OpenConfig | sensor-path openconfig-interfaces:interfaces/interface/state |
IOS-XR Sample Dial-Out Configlet
telemetry model-driven
destination-group dg-netim
address-family ipv4 11.11.11.11 port 57000
encoding self-describing-gpb
protocol grpc no-tls
!
!
sensor-group sg-netim
sensor-path openconfig-interfaces:interfaces/interface/state
sensor-path Cisco-IOS-XR-wdsysmon-fd-oper:system-monitoring/cpu-utilization
sensor-path Cisco-IOS-XR-nto-misc-oper:memory-summary/nodes/node/summary
!
subscription sub-netim
sensor-group-id sg-netim sample-interval 10000
destination-id dg-netim
!
!
Cisco IOS-XR Dial-In Support
Metric Class | Origin | YANG Model Path |
|---|
DEV_STATUS | Device | sensor-path Cisco-IOS-XR-nto-misc-oper:memory-summary/nodes/node/summary |
MEM_USAGE_v2 | Device | sensor-path Cisco-IOS-XR-nto-misc-oper:memory-summary/nodes/node/summary |
CPU_UTIL | Device | sensor-path Cisco-IOS-XR-wdsysmon-fd-oper:system-monitoring/cpu-utilization |
IFC_STATUS | OpenConfig | sensor-path openconfig-interfaces:interfaces/interface/state |
IFC_UTIL | OpenConfig | sensor-path openconfig-interfaces:interfaces/interface/state |
IFC_ERROR | OpenConfig | sensor-path openconfig-interfaces:interfaces/interface/state |
IOS-XR Sample Dial-In Configlet
grpc
port 57000
#TLS is enabled by default
no-tls
address-family ipv4
!
gNMI Config
[[inputs.cisco_telemetry_gnmi.subscription]]
origin = "openconfig"
path = "/interfaces/interface/state/"
subscription_mode = "sample"
sample_interval = "10s"
[[inputs.cisco_telemetry_gnmi.subscription]]
origin = "Cisco-IOS-XR-nto-misc-oper"
path = "/memory-summary/nodes/node/summary"
subscription_mode = "sample"
sample_interval = "10s"
[[inputs.cisco_telemetry_gnmi.subscription]]
origin = "Cisco-IOS-XR-wdsysmon-fd-oper"
path = "/system-monitoring/cpu-utilization"
subscription_mode = "sample"
sample_interval = "10s"
Streaming telemetry for Cisco NX-OS
Regardless of whether you are doing dial-in or dial-out on the Nexus, you must ensure the following features are enabled on your NX-OS device:
• feature telemetry
• feature grpc
• feature nxapi
• feature Netconf
NX-OS Sample Dial-Out Configlet
# Enable telemetry
telemetry
# Destination group with a unique identifier defines the receiver details
destination-group test-netim
ip address 10.46.250.197 port 57000 protocol gRPC encoding GPB
certificate /bootflash/telegraf.crt telegraf
# Sensor group with unique identifier specifies the data-source and the path to the metrics
sensor-group test-netim
data-source DME
path environment
path interface
path resources
# Subscription with unique identifier binds the destination group and the sensor group
# to the sample refresh internal
subscription 1
dst-grp test-netim
snsr-grp test-netim sample-interval 120000
Cisco NX-OS Dial-Out Support
Metric Class | Origin | YANG Model Path |
|---|
MEM_USAGE_v2 | Device | data-source DME path sys/procsys/sysmem/sysmemfree path sys/procsys/sysmem/sysmemusage path sys/procsys/sysmem/sysmemused |
CPU_UTIL | Device | data-source DME path sys/procsys/syscpusummary/syscpu-ALL/total |
IFC_STATUS | OpenConfig | path openconfig-interfaces:interfaces/interface/state path openconfig-interfaces:interfaces/interface/state/counters |
IFC_UTIL | OpenConfig | path openconfig-interfaces:interfaces/interface/state path openconfig-interfaces:interfaces/interface/state/counters |
IFC_ERROR | OpenConfig | path openconfig-interfaces:interfaces/interface/state path openconfig-interfaces:interfaces/interface/state/counters |
NX-OS Dial-In Sample Configlet
Additional configuration is not required for NX-OS dial-in.
Cisco NX-OS Dial-In Support
Metric Class | Origin | YANG Model Path |
|---|
DEV_STATUS | Device | /System/ch-items |
MEM_USAGE_v2 | Device | /System/procsys-items /System/procsys-items/sysmem-items/sysmemusage-items /System/procsys-items/sysmem-items/sysmemused-items /System/procsys-items/sysmem-items |
CPU_UTIL | Device | /System/procsys-items /System/procsys-items/syscpusummary-items/syscpu-items/SysCpu-list/total-items |
IFC_STATUS | OpenConfig | /interfaces/interface/state/oper-status /interfaces/interface/state/admin-status |
IFC_UTIL | OpenConfig | /interfaces/interface/state/counters |
IFC_ERROR | OpenConfig | /interfaces/interface/state/counters |
Streaming telemetry for Cisco IOS-XE
Cisco IOS-XE Dial-Out Support
Metric Class | Origin | YANG Model Path |
|---|
DEV_STATUS | Device | filter xpath /device-hardware-xe-oper:device-hardware-data/entity-information |
MEM_USAGE_v2 | Device | filter xpath /memory-ios-xe-oper:memory-statistics |
CPU_UTIL | Device | filter xpath /process-cpu-ios-xe-oper:cpu-usage/cpu-utilization |
IFC_STATUS | OpenConfig | filter xpath /oc-if:interfaces/interface/state |
IFC_UTIL | OpenConfig | filter xpath /oc-if:interfaces/interface/state |
IFC_ERROR | OpenConfig | filter xpath /oc-if:interfaces/interface/state |
IOS-XE Example Dial-Out Configlet
telemetry ietf subscription 1
encoding encode-kvgpb
filter xpath /memory-ios-xe-oper:memory-statistics
stream yang-push
update-policy periodic 2000
receiver ip address 11.11.11.11 57000 protocol grpc-tcp
telemetry ietf subscription 2
encoding encode-kvgpb
filter xpath /process-cpu-ios-xe-oper:cpu-usage/cpu-utilization
stream yang-push
update-policy periodic 2000
receiver ip address 11.11.11.11 57000 protocol grpc-tcp
telemetry ietf subscription 3
encoding encode-kvgpb
filter xpath /device-hardware-xe-oper:device-hardware-data/entity-information
stream yang-push
update-policy periodic 2000
receiver ip address 11.11.11.11 57000 protocol grpc-tcp
telemetry ietf subscription 4
encoding encode-kvgpb
filter xpath /oc-if:interfaces/interface/state
stream yang-push
update-policy periodic 2000
receiver ip address 11.11.11.11 57000 protocol grpc-tcp
Streaming telemetry for Arista EOS
Dial-in Sample Configlet
management api gnmi
transport grpc default
provider eos-native
Streaming telemetry for Juniper JUNOS
This information was tested on JUNOS vMX version 19.4. Check your specific JUNOS version and device model for compatibility.
Streaming telemetry support for JUNOS varies by OS version. Some devices require pre-setup configuration, including installing packages or agents that support OpenConfig, gNMI, a gRPC server, and a terminating endpoint for OpenConfig RPC interfaces (Network Agent).
JUNOS Support
Metric Class | Configured Path |
|---|
MEM_USAGE_v2 | /components/component/state/memory |
CPU_UTIL | /components/component/state/cpu |
IFC_UTIL IFC_ERROR | /interfaces/interface/state/counters/ |
IFC_STATUS | /interfaces/interface/state/oper-status |
Pre-setup configuration
On older versions of JUNOS, you need to download the OpenConfig packages. In newer versions, they are included by default but generally hidden. To make them visible, run:
set system schema openconfig unhide
JUNOS dial-in support
For dial-in configuration, you may need to download and install the NetworkAgent and OpenConfig modules, then create a self-signed certificate. For more information, refer to the Juniper guide.
Creating and installing a self-signed certificate:
1. Create a self-signed certificate using OpenSSL:
openssl req -x509 -sha256 -nodes -newkey rsa:2048 -keyout cert.pem -out cert.pem
2. Upload the certificate to the router using SCP:
scp cert.pem jcluser@<router-ip>:.
3. Download the certificate onto the router and install it:
set security certificates local jti-cert load-key-file cert.pem
Dial-In Configuration Example
set system services extension-service request-response grpc ssl port 32767
set system services extension-service request-response grpc ssl local-certificate jti-cert
set system services extension-service notification allow-clients address 100.123.35.0/32
Dial-In gNMI Configuration for Telegraf
[[inputs.gnmi]]
addresses = ["<device-ip>:32767"]
username = <username>
password = <password>
encoding = "proto"
redial = "10s"
enable_tls = false
insecure_skip_verify = true
[[inputs.gnmi.subscription]]
path = "/junos/system/linecard/cpu/memory/"
subscription_mode = "sample"
sample_interval = "10s"
JUNOS dial-out support
Dial-out support for JUNOS follows a similar pattern to other devices such as Cisco. You need to configure three main components:
1. Export profiles—Define the parameters of the export process for data generated through the Junos telemetry interface. You must configure at least one export profile, but you can configure multiple. Each export profile can be associated with multiple sensor profiles, but only one export profile can be associated with a specific sensor profile.
2. Streaming telemetry server profile—Defines the parameters of the server that collects exported telemetry data. You can define more than one server profile and associate the same server profile with more than one sensor profile.
3. Sensor profile—Defines the parameters of the system resource to monitor and stream data. You can enable only one system resource to monitor for each sensor profile. Configure a different sensor profile for each system resource you want to monitor. However, you can configure more than one sensor to monitor the same system resource with different export parameters.
Dial-Out Configuration Example
user@host# show services analytics
streaming-server telemetry-server {
remote-address 192.0.2.2;
remote-port 30000;
}
export-profile export-params {
local-address 192.0.2.3;
local-port 21111;
dscp 20;
forwarding-class assured-forwarding;
loss-priority high;
reporting-rate 20;
format gpb;
transport udp;
}
sensor interface-1 {
server-name telemetry-server;
export-name export-params;
resource /junos/system/linecard/interface/logical/usage/;
resource-filter et-*;
}
Verifying Dial-Out Configuration
If you unhide the OpenConfig commands on JUNOS devices using set system schema openconfig unhide, this enables the OpenConfig CLI, which has a separate set of commands similar to the native JTI commands for enabling dial-out streaming telemetry. However, dial-out using these OpenConfig CLI commands may not work with JTI in all cases.
You can verify your sensor configuration using the following command:
user@host> show agent sensors
This displays sensor information including the sensor name, resource path, server details, and export profile parameters.
Streaming telemetry support and certificates
You can configure NetIM Streaming Telemetry to use TLS with either CA-signed or self-signed certificates.
CA-signed certificates
When the Model-driven Telemetry microservice’s telegraf instance starts up, required keys and certificates are created in a directory on the NetIM Core VM:
/home/netimadmin/common/core-tenant-stack/1/telemetry-telegraf/cert
The files of interest are:
• telegraf.key (telegraf’s private key)
• telegraf.csr (telegraf’s signing request)
• telegraf.pem (the signed telegraf certificate)
The telegraf instance configuration file points to both the telegraf.key and telegraf.pem file, by default. At the end of the signing process, both of those files need to be used/paired from the signing process and need to be named exactly as shown.
In order to use an external root CA, perform the following steps:
1. Retrieve the telegraf.csr/copy its contents
if you want to create your own .csr you can use the existing telegraf.key as the base
2. Execute a signing request with the root CA, an example command shows this as follows:
Example: openssl x509 -req -in telegraf.csr -CA rootCA.pem -CAkey rootCA.key -CAcreateserial -out telegraf.pem -days 3650 -sha256
This will create the signed certificate in ‘telegraf.pem’
3. Copy the newly signed telegraf.pem file and overwrite the original one at <NetIM core host>/<user home>/telemetry-telegraf/cert
If you want a different telegraf.key with an original telegraf.csr then the .key file must also be copied over
4. Restart the telemetry-telegraf service
5. Copy the rootCA.pem file over to the dial-out enabled streaming telemetry devices and configure accordingly
Self-Signed Certificates
When the streaming telemetry collector service starts up, it will create (if they do not already exist) a new private key for telegraf and a self-signed certificate for devices to use for dial-out. The self-signed certificates will be generated in the form of telegraf.crt and telgraf.pem as well as the private key and signing request in telegraf.key and telegraf.csr, respectively. NetIM stores these files on the NetIM Core VM in the directory: /home/netimadmin/common/core-tenant-stack/1/telemetry-telegraf/cert
If you want to use NetIM-generated self-signed certificates for dial-out workflows, you need to copy the certificate (telegraf.pem) to the respective devices and configure accordingly.